WindCode calculates site wind speeds and design pressures for buildings in accordance with AS/NZS 1170.2:2021. The tool evaluates all 8 cardinal directions and determines the governing (critical) wind direction.
The fundamental equation the tool solves is:
Where each multiplier accounts for a different physical factor affecting the wind speed at your site. The tool then converts wind speed to dynamic pressure:
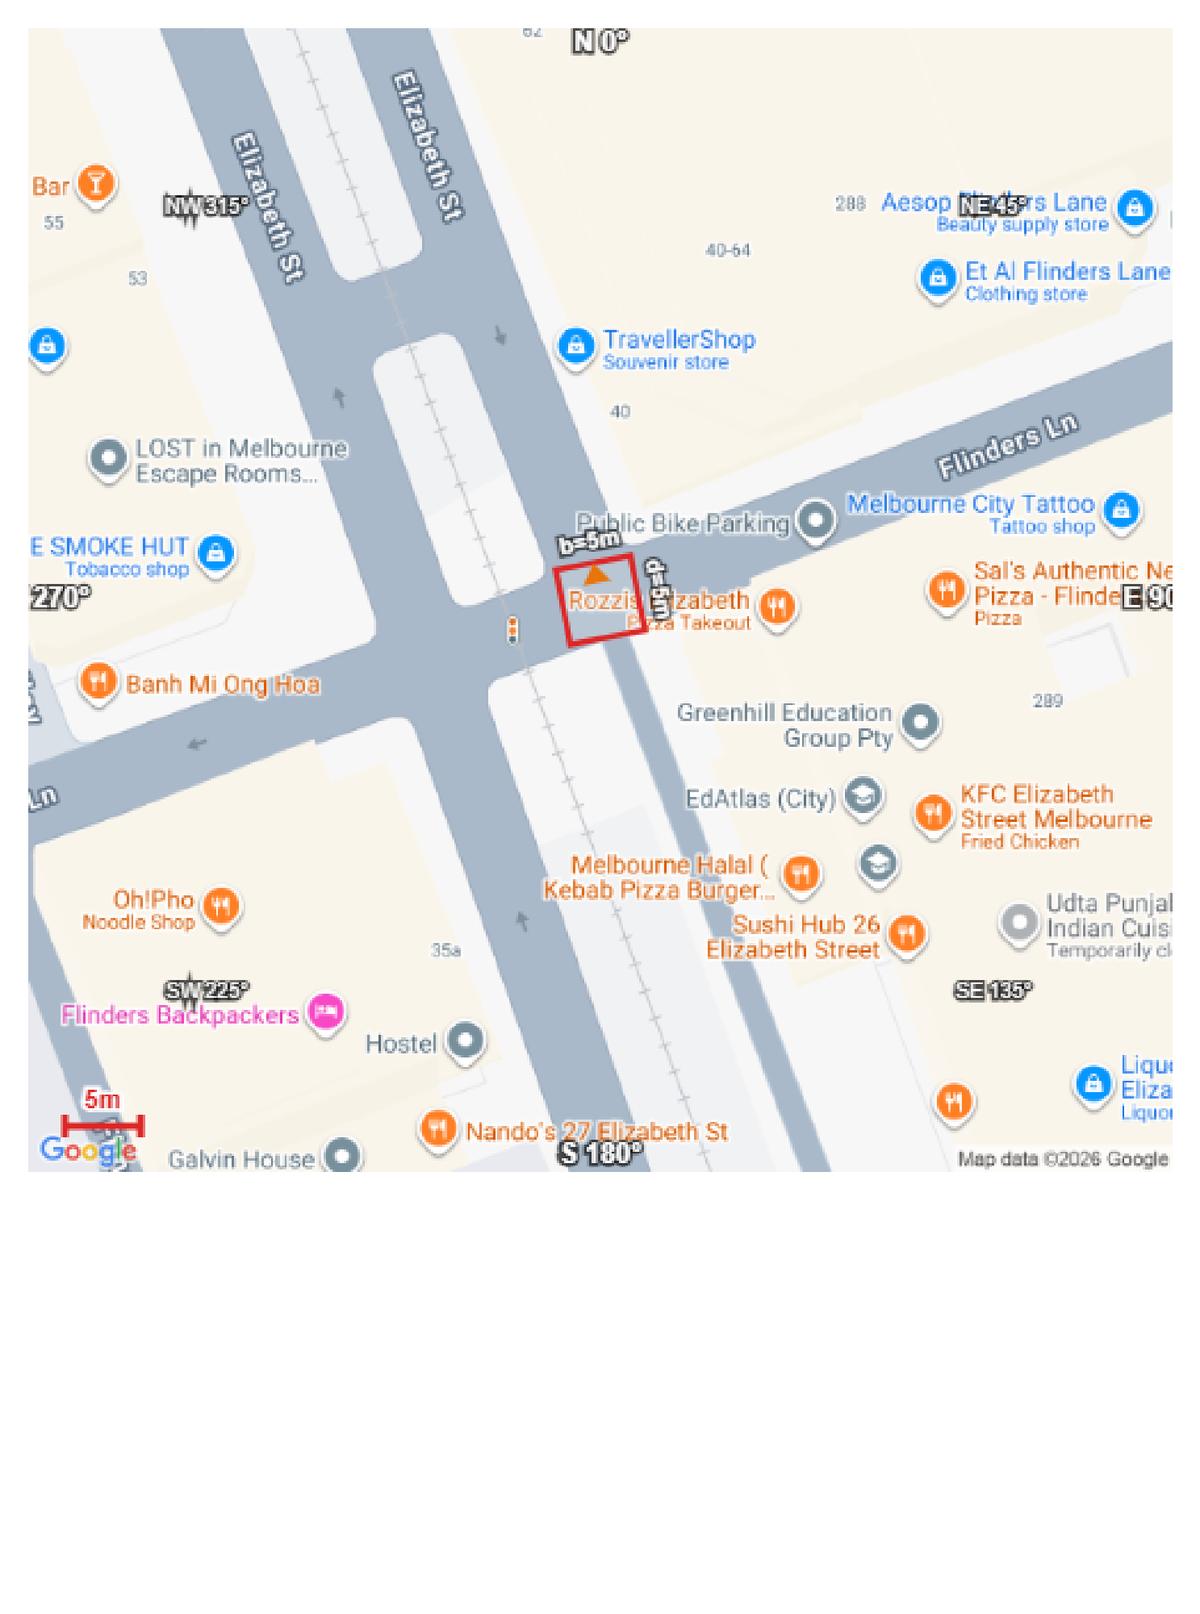
Enter the Site Address
Start by typing the site address into the search bar. WindCode uses Google Maps to pinpoint the location and automatically determine several key inputs:
- Wind Region — the tool identifies the AS/NZS 1170.2 wind region (A1–A7, B1–B2, C, D) based on the site coordinates
- Terrain Category zones — colour-coded overlays at 250m, 500m, 750m, and 1000m rings around the site
- Topographic elevation profiles — fetched via Google Elevation API for all 8 directions, used to calculate Mt
Tip: This step is optional. You can skip it and manually select the wind region, terrain category, and topographic multiplier instead.
Define Building Geometry
Enter the building’s physical dimensions. These are critical for calculating pressure coefficients and local pressure zones:
- Width (b) — the across-wind dimension (perpendicular to wind direction)
- Depth (d) — the along-wind dimension (parallel to wind direction)
- Height (h) — eave height or mean roof height above ground
- Roof Type — flat, monoslope, gable, or hip
- Roof Pitch — angle in degrees (0° for flat roofs)
- Orientation — the compass bearing of the building’s front face (use the interactive compass widget to set this)
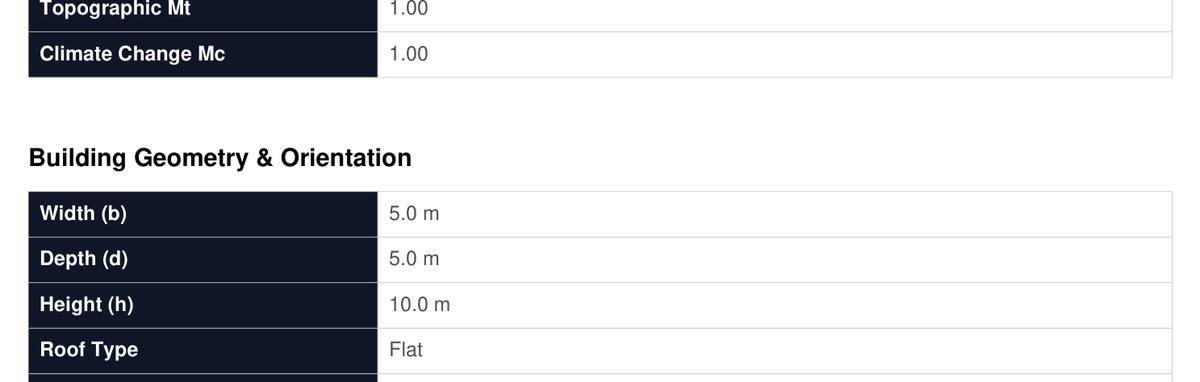
Important: For fitout or elements within an existing building, always use the full building dimensions — not the element dimensions. Using element-only dimensions gives an artificially small ‘a’ dimension and can miss edge/corner pressure zones, resulting in unconservative results.
Set Wind Parameters
Configure the design parameters that determine the regional wind speed and annual probability of exceedance:
- Wind Region — auto-detected from address, or select manually (A1–A7, B1–B2, C, D)
- Importance Level — IL1 (low), IL2 (normal residential/commercial), IL3 (high consequence), IL4 (post-disaster)
- Design Working Life — typically 50 years for permanent structures
- APE (Annual Probability of Exceedance) — derived from Importance Level and Design Working Life. ULS = 1/500 and SLS = 1/25 for typical IL2 buildings
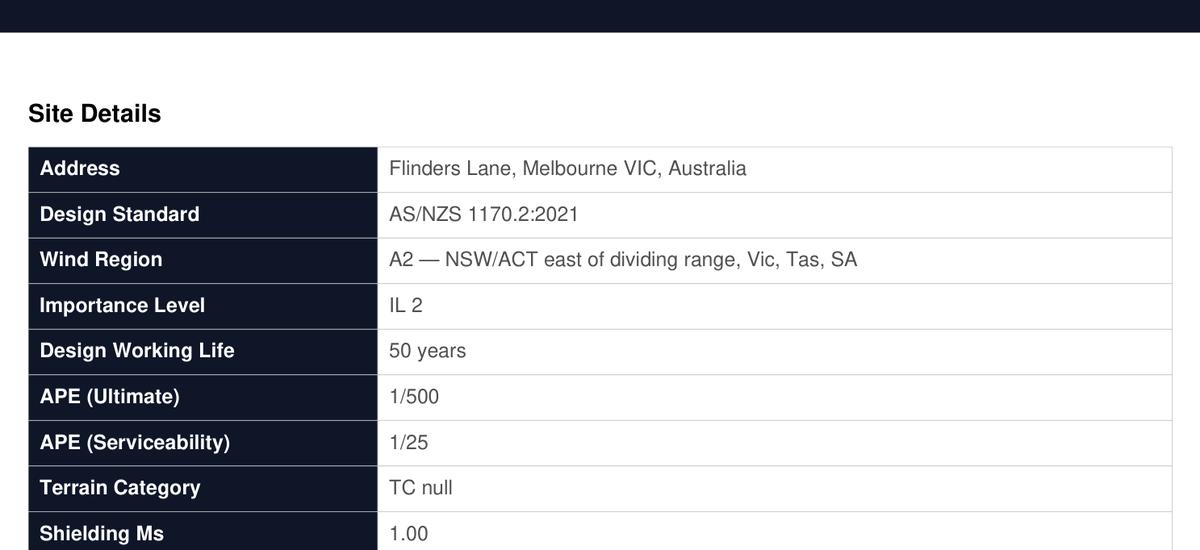
The regional wind speed VR is looked up from Table 3.1 based on the wind region and APE. For example, Region A2 with 1/500 APE gives VR = 45.0 m/s (ULS).
Understanding the Multipliers
WindCode calculates the site wind speed by applying five multipliers to the regional wind speed. Each multiplier accounts for a distinct physical effect on the wind. Here’s what each one means:
Md — Direction Multiplier
Accounts for the directional variation in wind climate. Some directions have stronger winds than others. Values range from 0.75 to 1.0 depending on region and direction (Table 3.2). A value of 0.95 means the wind from that direction is 5% less severe than the worst-case.
Mz,cat — Terrain/Height Multiplier
Accounts for terrain roughness and building height. Wind is slower near the ground in rough terrain (cities) and faster over open terrain (coastal). Calculated from terrain category (TC1–TC4) and building height (Table 4.1). Higher buildings = higher Mz,cat.
Ms — Shielding Multiplier
Accounts for shielding from surrounding buildings or structures. Range: 0.7 to 1.0. A value of 1.0 means no shielding (conservative). Lower values can be used when significant upwind shielding exists (Clause 4.3).
Mt — Topographic Multiplier
Accounts for speed-up effects from hills, ridges, and escarpments. Range: 1.0 to 2.0. Flat terrain = 1.0. Sites on hilltops or escarpments have accelerated wind speeds. Calculated from elevation profiles per Section 4.4.
Mc — Climate Change Multiplier
Accounts for projected increases in wind speed due to climate change. Default 1.0 for current conditions. Can be increased for future-proofing long-design-life structures (new in 2021 edition).
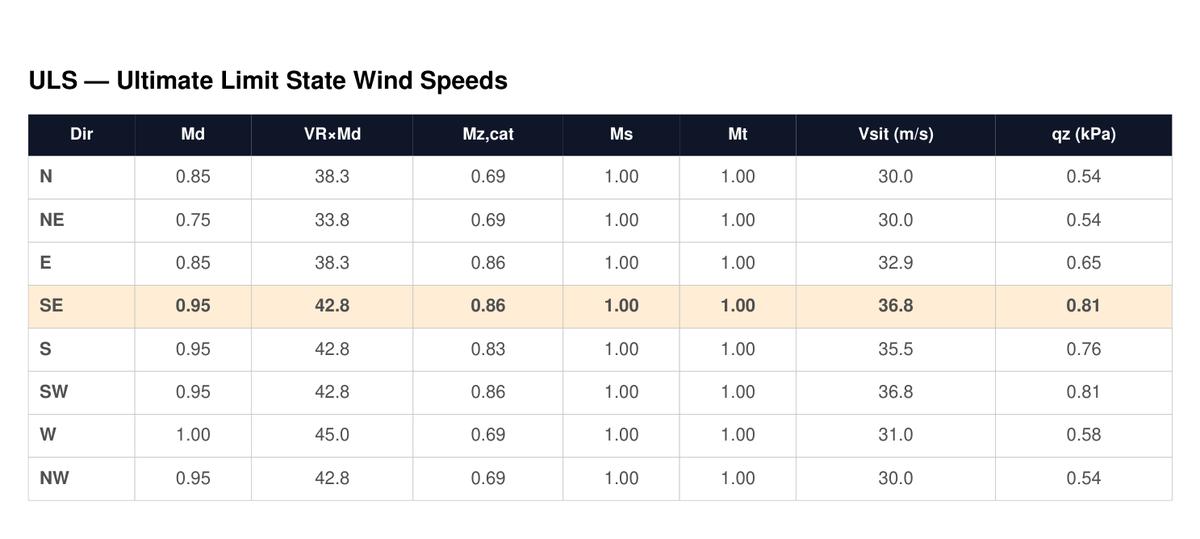
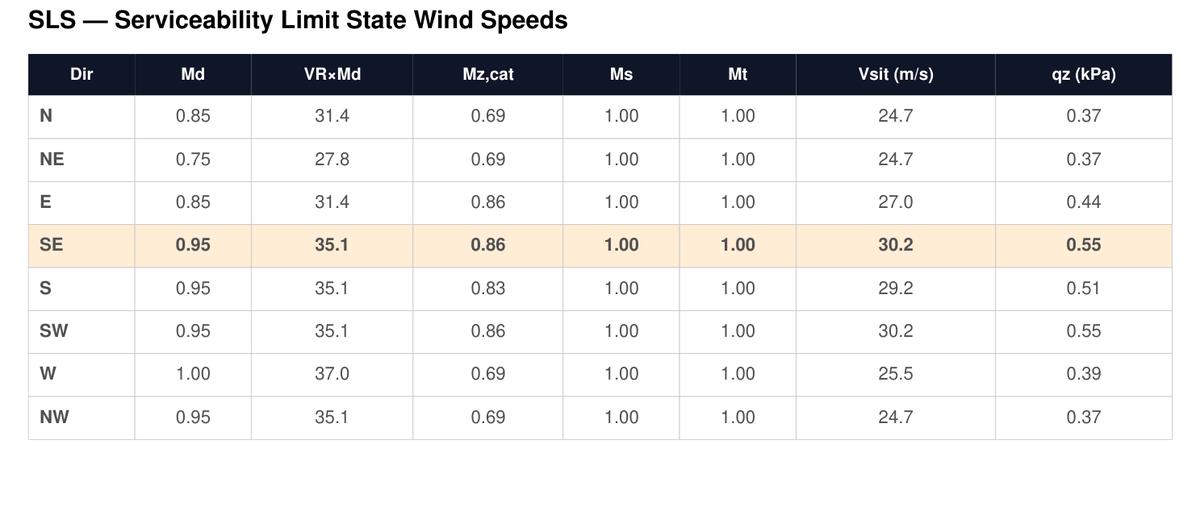
How to read the table: For each direction, Vsit = VR × Md × Mz,cat × Ms × Mt × Mc, with a minimum of 30 m/s. The dynamic pressure qz = 0.0006 × Vsit² (kPa).
Terrain Category (Mz,cat in Detail)
Terrain category is one of the most impactful multipliers. It classifies the ground roughness surrounding the site, which determines how much the wind is slowed by surface friction:
- TC 1 — Open water, mud flats (highest wind speeds)
- TC 2 — Open terrain, grassland, few scattered obstructions
- TC 2.5 — Suburban fringe, developing areas
- TC 3 — Suburban terrain, numerous close obstructions (most common for residential)
- TC 3.5 — Dense suburban, light industrial
- TC 4 — City centres, dense urban with tall buildings (lowest wind speeds)
When a site address is entered, WindCode displays terrain category zone overlays on the satellite map at 250m, 500m, 750m, and 1000m distance rings. You can click each zone per direction to set the terrain category at each distance, and the tool blends them into the effective Mz,cat per Section 4.2.
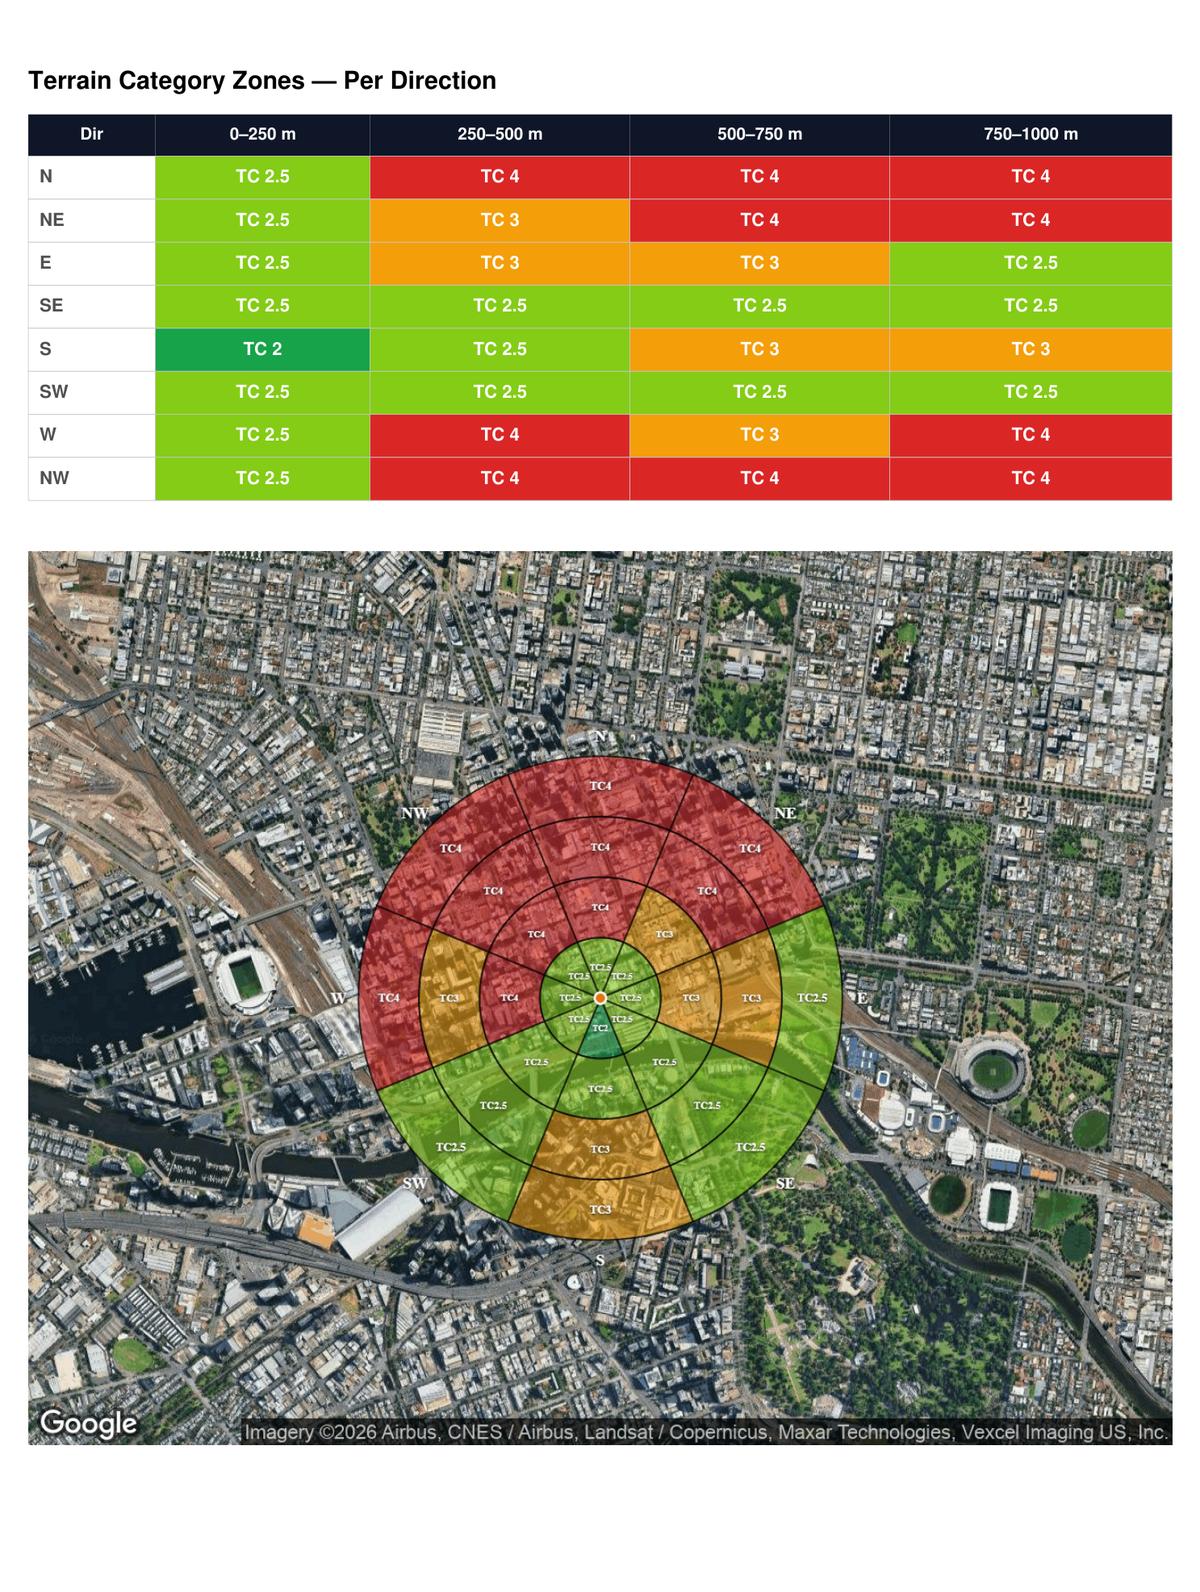
Tip: The terrain category can vary by direction. A coastal site might be TC 1.5 towards the ocean (East) but TC 3 towards the suburbs (West). WindCode handles this per-direction automatically.
Topographic Multiplier (Mt in Detail)
Wind accelerates over hills, ridges, and escarpments. The topographic multiplier Mt captures this effect per Section 4.4 of the standard.
When a site address is entered, WindCode automatically fetches elevation profiles from Google Elevation API along 8 cardinal directions (±5 km from the site). It then analyses each profile to determine:
- Feature type — hill, ridge, or escarpment (or flat)
- H — height of the feature (m)
- Lu — upwind slope length (m)
- x — distance from crest to site (m)
- Slope — average slope (H / 2Lu)
- Mh — hill-shape multiplier per Table 4.4
The governing (maximum) Mt from all directions is used. For flat terrain, Mt = 1.0.
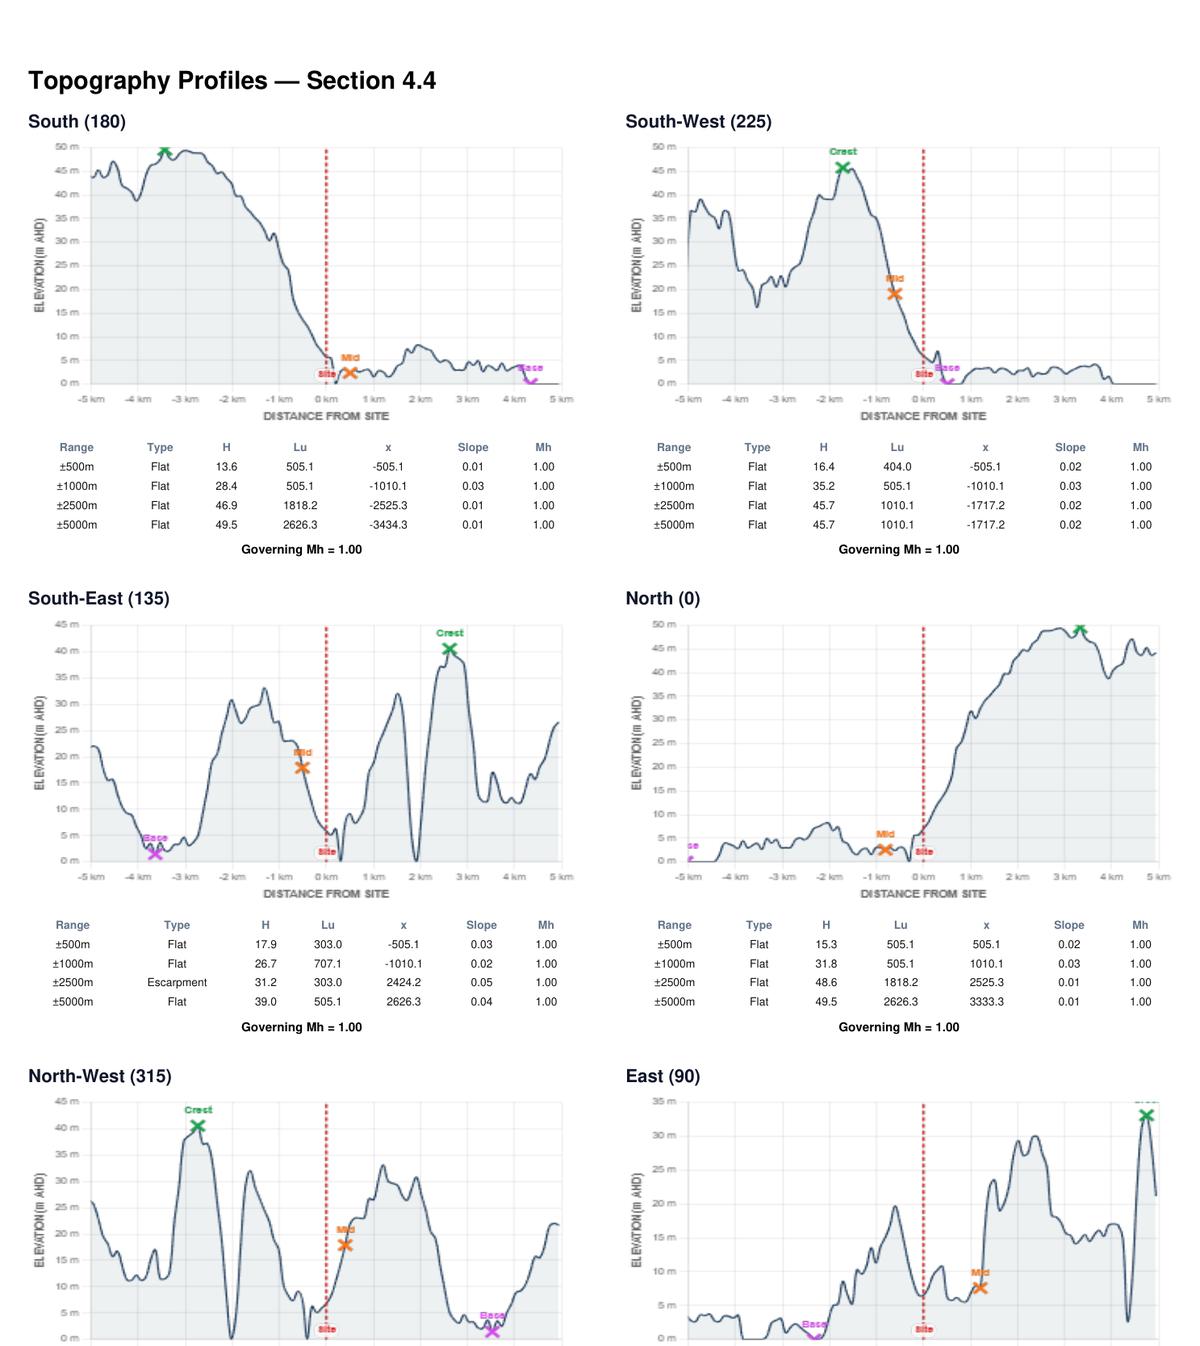
Tip: If the site is on or near a hilltop, the Mt value can significantly increase the design wind speed. Always review the elevation profiles to verify the automatic calculation makes sense for your site.
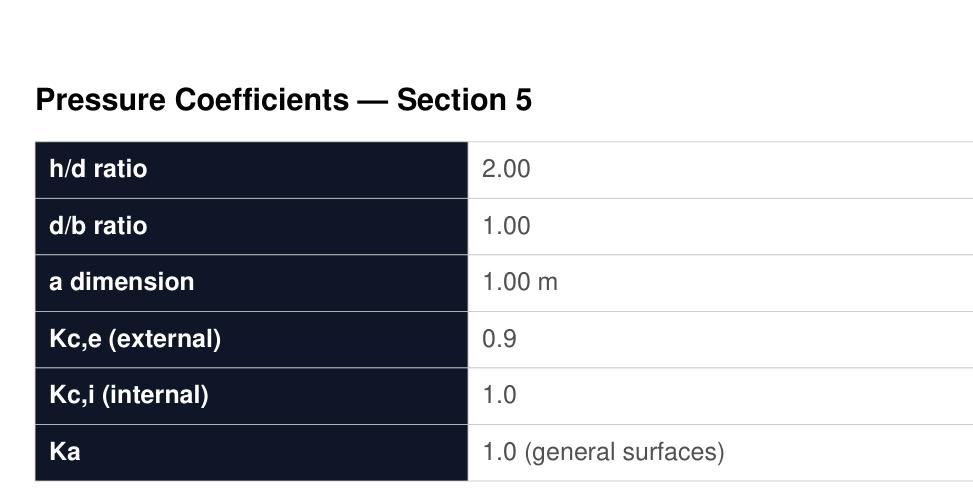
Pressure Coefficients
Once the wind speeds are determined, WindCode calculates pressure coefficients per Section 5 of the standard. These depend on the building geometry ratios:
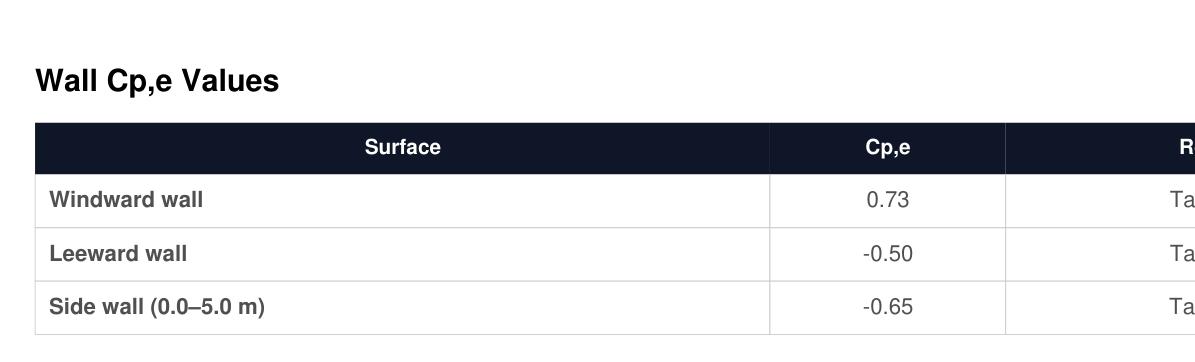
External Pressure Coefficients (Cp,e)
These describe how wind pressure is distributed across the building surfaces:
- Windward wall — positive pressure (wind pushing inward), from Table 5.2(A)
- Leeward wall — negative pressure (suction), from Table 5.2(B)
- Side walls — negative pressure (suction), from Table 5.2(C)
- Roof — varies by zone, roof type, and pitch, from Tables 5.3
Internal Pressure Coefficients (Cp,i)
WindCode evaluates both internal pressure cases: +0.2 (positive internal pressure from open windward wall) and −0.3 (negative internal pressure from open leeward wall). Both cases are checked for the worst-case net pressure on each surface.
Wall Design Pressures
For each of the 8 wind directions, WindCode calculates the net design pressure on every wall surface, including edge and corner zones with local pressure factors (Kl):
- Front (Windward) — general area, Kl = 0.9
- Back (Leeward) — general area, Kl = 0.9
- Side wall (worst zone) — general area, Kl = 0.9
- Windward wall edge (0–a) — within distance ‘a’ from edge, Kl = 1.5
- Side wall edge (0–a) — within distance ‘a’ from edge, Kl = 1.5
- Side wall corner (0–a/2) — within distance ‘a/2’ from corner, Kl = 2.0
The local dimension is calculated as: a = min(0.2b, 0.2d, h)
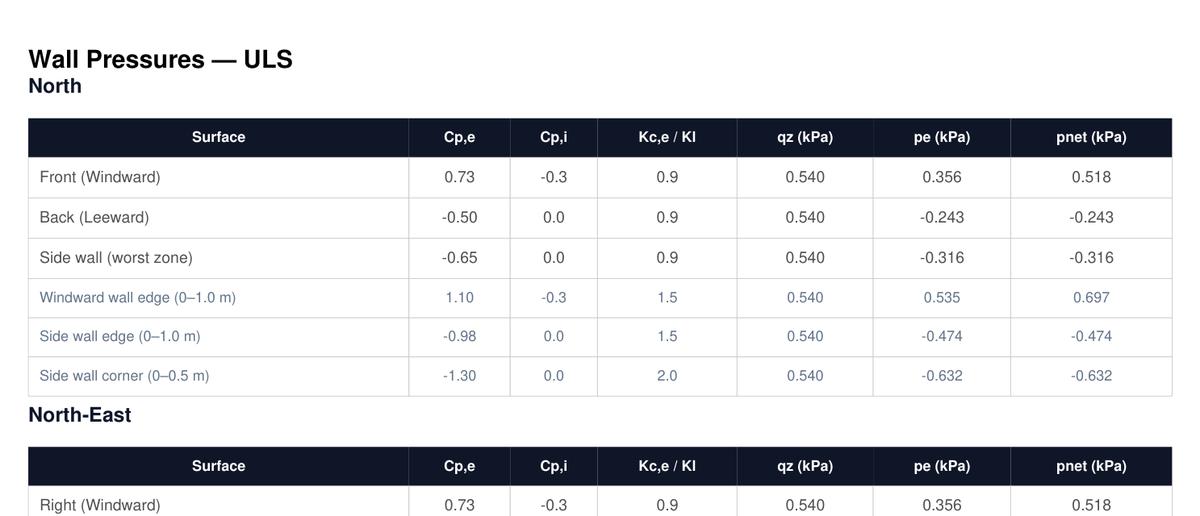
Important for cladding: The maximum negative ULS pressure in the final summary includes roof suction — this is NOT the wall cladding pressure. Compare wall cladding pressures separately against product limits (e.g., CodeMark 2.5 kPa condition).
Roof Design Pressures
Roof pressures are calculated for each wind direction with zone-dependent coefficients that account for flow separation and vortex effects:
- Upwind (0–h) — region from windward edge to distance h
- Upwind (h–2h) — region from h to 2h from windward edge
- Upwind (2h–3h) — region beyond 2h
- Downwind — remainder of roof past the upwind zones
- Roof edge (0–a) — edge zone, Kl = 1.5
- Roof corner (0–a/2) — corner zone, Kl = 2.0 to 3.0 (most severe suction)
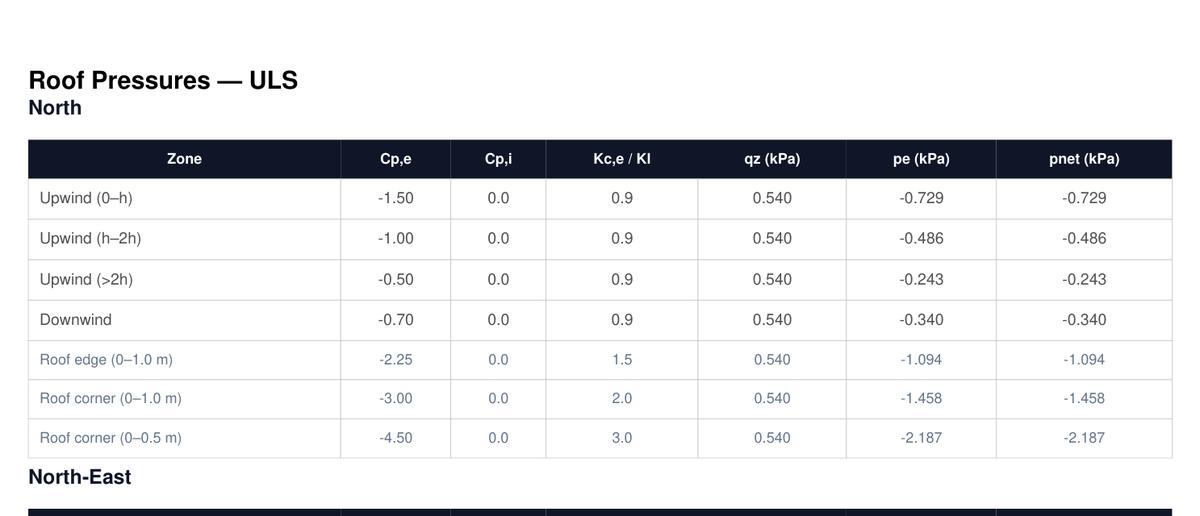
Tip: Roof corner zones (Kl = 3.0) experience the highest suction pressures. These are critical for fixing design of roof sheeting and cladding at corners.
Summary & Export
The summary section consolidates all results into the key governing values you need for design:
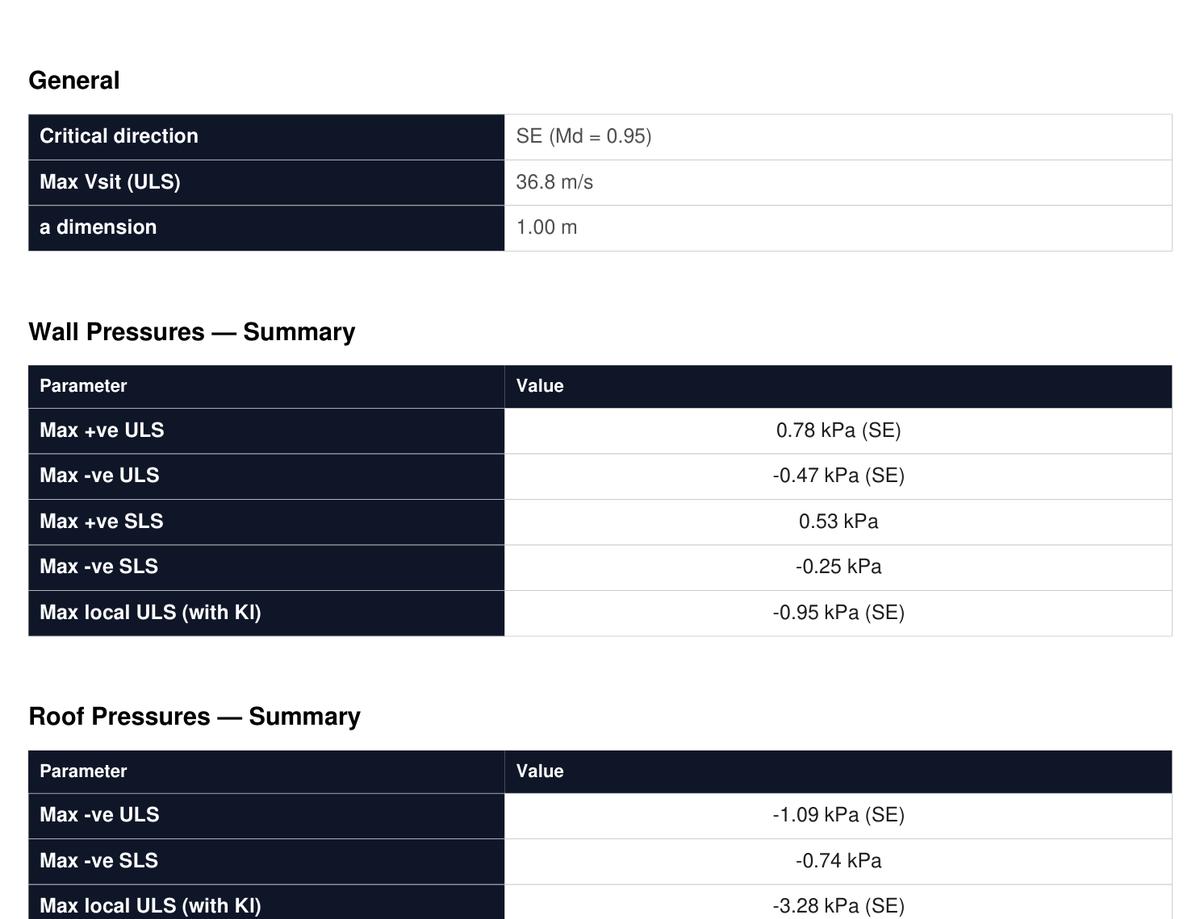
Key outputs include:
- Critical direction — the wind direction that produces the highest pressures
- Max Vsit (ULS) — the governing site wind speed
- a dimension — the local pressure zone dimension
- Max +ve ULS wall pressure — maximum inward (positive) pressure on walls
- Max −ve ULS wall pressure — maximum suction (negative) pressure on walls
- Max local ULS (with Kl) — maximum pressure including edge/corner factors
- Max −ve ULS roof pressure — maximum roof suction
- SLS equivalents — serviceability pressures for deflection checks
Click Download PDF Report to generate a comprehensive multi-page PDF with all input parameters, multiplier tables, pressure calculations for all 8 directions, terrain category map, topographic profiles, and the summary. Ready to drop into your project files.
Ready to try it?
Launch WindCode →